
Gas Mileage Estimator
EPA ratings are measured under standard test conditions. This estimator starts from your car's city and highway MPG and adjusts for how you actually drive — the share of city driving, highway speed, extra weight, a roof box and tire pressure — to estimate your real-world mileage and cost.
- Free to use
- No sign-up
- Runs in your browser
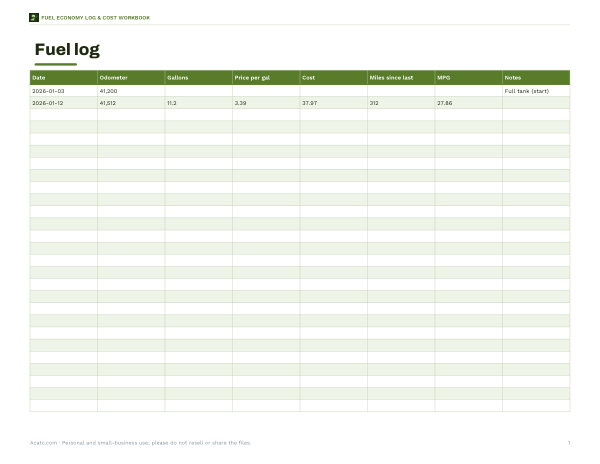
Estimate your gas mileage
Fuel Economy Log & Cost Workbook
Log every fill-up, see your true MPG trend and fuel cost per month, and compare vehicles side by side.
- Fill-up log & MPG trend (XLSX, PDF)
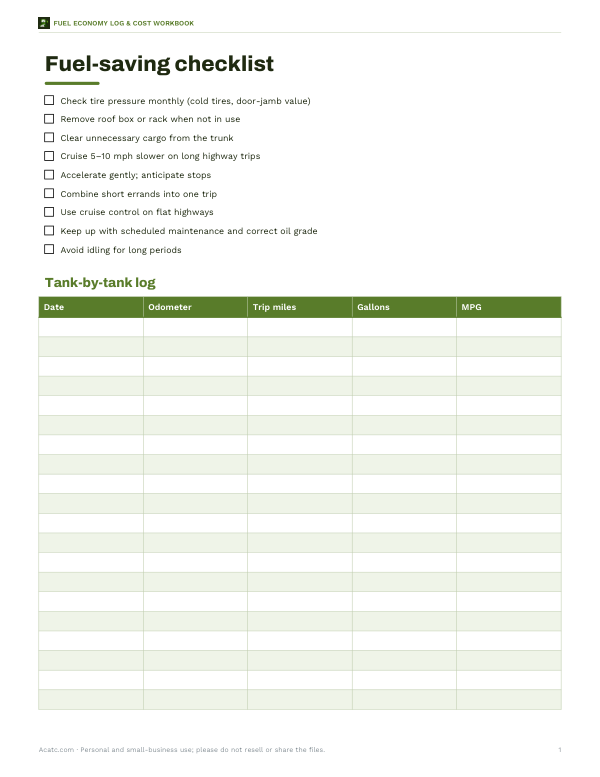
- Printable fuel-saving checklist (PDF, DOCX)
Formats: XLSX, PDF, DOCX. Instant download after payment (link valid 72 hours, up to 5 downloads). AI-assisted: the templates were drafted with AI help and reviewed and laid out before publishing.
$4.00 USD, one-time
- Instant download
- 7-day refund
- Secure checkout by Stripe
7-day money-back guarantee. Full refund within 7 days of purchase, even after you download.
Full refund within 7 days — see the refund policy and license.
Free printables
Single sheets you can print right now, no sign-up. The full pack adds every sheet in one download plus the editable files.
What this estimator does
Every new car sold in the United States carries EPA fuel economy ratings for city, highway and combined driving. They are measured in a laboratory on a standard schedule so that cars can be compared fairly, and since 2008 they have been adjusted downward to reflect higher speeds, faster acceleration, air conditioning and cold weather. Even so, your own mileage depends on how, where and what you drive. This estimator takes the two ratings from your car's window sticker or fueleconomy.gov and applies a set of simple adjustments to get closer to what you will see at the pump.
How the estimate is built
- Driving mix. Instead of the EPA's fixed 55% city / 45% highway weighting, the estimator uses your own share. Fuel economy is averaged by fuel used, not by miles, so it uses a harmonic mean: 1 ÷ (city share ÷ city MPG + highway share ÷ highway MPG).
- Highway speed. Most cars reach their best mileage somewhere between about 40 and 55 mph, and aerodynamic drag rises steeply above that. The estimator reduces highway mileage by about 7% for every 5 mph above 50 mph, which is in line with the range the Department of Energy describes.
- Extra weight. Each additional 100 pounds reduces mileage by roughly 1%, with smaller cars affected more than large ones.
- Roof rack or box. Roof cargo boxes add drag, which matters most at highway speed; the estimator applies a larger penalty on the highway than in town.
- Tire pressure. Mileage drops about 0.2% for every 1 psi drop in the average pressure of all four tires.
- Driving style. Hard acceleration and braking can lower mileage substantially, especially in stop-and-go traffic.
Worked example
A compact sedan is rated 28 MPG city and 36 MPG highway, so its EPA combined figure is about 31 MPG. You drive 55% in town and cruise at 70 mph on the highway, carrying about 100 pounds of tools, with tires 4 psi low and an average driving style. The higher speed cuts highway mileage by about 28%, and weight, tires and style trim a few more percent, giving roughly 26 MPG in real use. At $3.40 a gallon and 12,000 miles a year, that is about 460 gallons and $1,560 in fuel — around $200 more than the EPA combined rating would suggest.
The biggest levers on your mileage
| Change | Typical effect on MPG | Notes |
|---|---|---|
| Slow from 75 to 65 mph on the highway | About +10–15% | Drag rises with the square of speed |
| Smooth acceleration and braking | Up to +10–30% versus aggressive driving | Largest gains in stop-and-go traffic |
| Remove an unused roof box | A few percent in town, more on the highway | Racks also add drag when empty |
| Inflate tires to the door-jamb pressure | Up to about +3% | Also improves handling and tire life |
| Remove 100 lb of cargo | About +1% | More for small cars |
| Avoid long idling | Saves roughly a quarter to half a gallon per hour idled | Depends on engine size and A/C use |
Why your MPG may still differ
- Weather: cold weather lowers mileage — short trips in freezing temperatures can cut it markedly — and heavy air-conditioning use on hot days also costs fuel.
- Trip length: engines are least efficient while warming up, so many short trips average worse than one long one.
- Terrain and wind: hills, headwinds and rough roads all add load.
- Fuel blend: winter-blend gasoline and fuels with higher ethanol content contain slightly less energy per gallon.
- Vehicle condition: dragging brakes, misaligned wheels or the wrong oil viscosity add losses.
- Hybrids and EVs: they are more sensitive to temperature and speed, and regenerative braking changes how city and highway compare.
How to check your actual mileage
The simplest reliable method is the fill-to-fill log. Fill the tank completely and reset your trip odometer. Drive normally. At the next fill-up, fill completely again and note the gallons added. Miles on the trip odometer divided by gallons is your MPG for that tank. Repeat over several tanks and average them, because a single tank can be skewed by one long highway trip. The car's dashboard computer is a useful guide but can read a few percent high.
Converting MPG and L/100 km
Outside the US, fuel consumption is usually stated as litres per 100 kilometres, which works the opposite way round: lower is better. To convert, divide 235.2 by the figure — 30 MPG is about 7.8 L/100 km, and 6 L/100 km is about 39 MPG. UK and Canadian “MPG” figures use the larger imperial gallon, so a UK MPG number is about 20% higher than the US MPG for the same car.
Using the estimate to compare cars
If you are choosing between two vehicles, run the estimator for both with your own driving mix and speed rather than comparing the combined ratings alone. A car with a strong highway rating matters more if most of your miles are interstate at 70 mph; a hybrid with an outstanding city rating pays off most in town. Multiply the difference in fuel cost per year by the number of years you expect to keep the car, and weigh it against any difference in purchase price, insurance and maintenance.
Frequently asked questions
How is EPA combined MPG calculated?
It weights 55% city and 45% highway driving using a harmonic mean of the two ratings.
What speed gives the best gas mileage?
For most cars the sweet spot is roughly 40–55 mph. Above about 50 mph, mileage falls as speed rises.
Does air conditioning use a lot of gas?
On very hot days, heavy A/C use can reduce mileage noticeably, especially on short trips. At highway speed, open windows add drag too, so the difference is smaller.
Why is my real MPG lower than the sticker?
Speed, short trips, cold weather, cargo, tire pressure and driving style all differ from the test conditions.
Can I use this for trucks and SUVs?
Yes. Larger vehicles lose a smaller percentage per 100 lb of cargo but are often more affected by roof boxes and towing, which this tool does not model.